Statistics - Determining if two sets of data are significantly different

Courtney

Artifact Armor
Adventurer
Joined
Jun 9, 2004
Messages
1,196
Linkshell
Kaizen
Been too many years since I left Uni (and I was never that hot at this area of statistics anyway), so hoping someone here can dumb it down here for me. I have several sets of data and I'm trying to determine whether the differences are statistically significant or not.

Set 1: Average = 1.967 SD = 2.050 n = 24
Set 2: Average = 2.396 SD = 1.675 n = 29
Set 3: Average = 2.714 SD = 1.636 n = 27
Set 4: Average = 1.909 SD = 1.173 n = 30
Set 5: Average = 3.156 SD = 1.263 n = 30

I'd like to know for:
Set 1 v Set 4
Set 1 v Set 2
Set 2 v Set 4
Set 1 v Set 3
Set 1 v Set 5
Set 4 v Set 3
Set 4 v Set 5
whether the differences in the averages are statistically significant or not. I have all the original data if its needed, just too lazy to type it all in if it isn't.

Any help from the intelligent out there would be appreciated.

(Oh, and this is FFXI data, that "apparently" shows a previously unknown correlation between a stat and an effect. I'd rather not bias any evaluation by saying what it is before I have some numbers).
 
Been too many years since I left Uni (and I was never that hot at this area of statistics anyway), so hoping someone here can dumb it down here for me. I have several sets of data and I'm trying to determine whether the differences are statistically significant or not.

Set 1: Average = 1.967 SD = 2.050 n = 24
Set 2: Average = 2.396 SD = 1.675 n = 29
Set 3: Average = 2.714 SD = 1.636 n = 27
Set 4: Average = 1.909 SD = 1.173 n = 30
Set 5: Average = 3.156 SD = 1.263 n = 30

I'd like to know for:
Set 1 v Set 4
Set 1 v Set 2
Set 2 v Set 4
Set 1 v Set 3
Set 1 v Set 5
Set 4 v Set 3
Set 4 v Set 5
whether the differences in the averages are statistically significant or not. I have all the original data if its needed, just too lazy to type it all in if it isn't.

Any help from the intelligent out there would be appreciated.

(Oh, and this is FFXI data, that "apparently" shows a previously unknown correlation between a stat and an effect. I'd rather not bias any evaluation by saying what it is before I have some numbers).

Too lazy to actually do the math, but I will give a quick synopsis. BAsically, you're doing a significance test to show whether the variation between two given sets of data is just due to random variation or are they actually different sets of data independant from each other (I assume you understand as much). Your null hypothesis should be that the data is in fact the same and has no variation beyond that of just it's own randomness or Ho = X1 - X2 = O versus Ha = X1 - X2 =/= 0

You'll have to excuse the syntax, I can't type mathematical symbols on my computer anymore, I lost the plugin for Word to do so and I am not sure how you can do it without. At any rate, X will be the average for a sample, s is the standard deviation and n is the sample size while the number next to each letter is the set number. Ho is the null hypothesis while Ha is the alternative hypothesis.

Z = (X1 - X2) / (s1^2/n1 + s2^2/n2)^(1/2)

Z is the Z number which you can use to plugin to your Z table. Depending on what you are testing, it can be double or single sided, which is something I cannot determine from your previous statement. The value from the Z table should be compared to your Signifance level which is usually 1% or 5%. If the value you obtained is less than the signicance level, you can reject the null hypothesis and accept that the data is statistically significant.

I believe that is all you needed.
 
OK,

so if I'm comparing Sets 1 and 4 the formula would be:

Z = (X1 - X2) / (s1^2/n1 + s2^2/n2)^(1/2)
Z = (1.967-1.909/ SQRT(2.05^2/24+1.173^2/30)
Z = 0.12338

Is the decision on Z table based on the form of the curve (involving degrees of freedom maybe?). My guess would be that rather than a purely Normal distribution, I have a curve with a decent tail on the right hand side of the graph (if that helps).

Did a search of Z table through google, and I'm finding a whole lot of different tables that are confusing me a bit...
 
I'll just say this and edit it later once I can find get to a computer that has my stat program on it, but from looking at that data it seems none of it is significant. The standard deviations are too large and averages too close together.
 
OK,

so if I'm comparing Sets 1 and 4 the formula would be:

Z = (X1 - X2) / (s1^2/n1 + s2^2/n2)^(1/2)
Z = (1.967-1.909/ SQRT(2.05^2/24+1.173^2/30)
Z = 0.12338

Is the decision on Z table based on the form of the curve (involving degrees of freedom maybe?). My guess would be that rather than a purely Normal distribution, I have a curve with a decent tail on the right hand side of the graph (if that helps).

Did a search of Z table through google, and I'm finding a whole lot of different tables that are confusing me a bit...

I quickly checked the formula and it looks correct although it's again hard for me to check the actual math, I don't have a good calculator in front of me to test it so I assume it's correct. There really is only one Z table, although I believe there are different names and one's that serve different equations, but in our case, we just want the standard basic table.

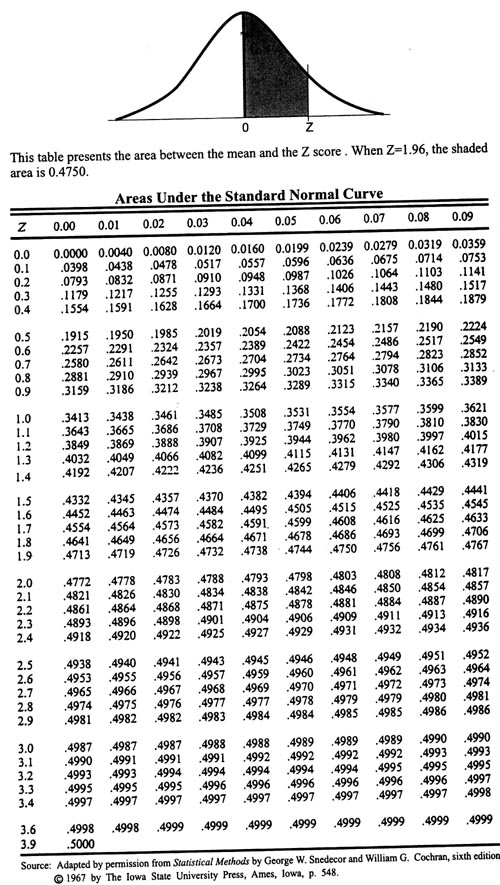
z-table.JPG


The above table should have all the information you need. Just take the value of Z = 0.12 (it only goes to the hundredth place and really, that's all you would need) into the table. So go to the 0.10 row and the 0.02 column to find your value. The area under the curve is 0.0438 for the given example. Now, this value might not be necessarily be what you desired since once again, I don't know your null hypothesis. It's the area under the curve, the black section, so if you only require the tail end to the right of it then that would be 1 - 0.0438 - 0.5 = 0.4562 (subtract 50% since the curve is symmetric and therefore the left section is exactly 50%) or you might need tail ends on both sections which would be double 0.4562.

However, as Psylent said, after looking at your numbers, the standard deviations are way too high and the averages are too close which means you are only proving the null hypothesis (whatever it may be) that the two sets of data are not statistically different. That is to say, the possibility could be that they are different but you cannot prove that they are with your current data sets. You would need to obtain more data with larger data pools for any real comparison. To save yourself a little time, just obtain a single data set and plug it into the formula. If the Z value is not around 1.5-2.0, I wouldn't bother testing any further and just assume they are statistacally the same.
 
If you're comparing two sets of data you're not going to be using Z's you should be using T's
 
If you're comparing two sets of data you're not going to be using Z's you should be using T's

I cannot comment on that directly since I lack any textbook or notes in front of me to give a precise response, but are you entirely positive? I used the equation that came directly from my textbook and given the fact the equation I provided is for this exact circumstance and it uses the variable Z, I would guess that a Z table is very much correct.
 
I'm happy for the null hypothesis to be that the sets of numbers aren't statistically different. If I can show that (or not show that) between the various sets of data, then I'll be happy. I agree that the standard deviations are high compared to the averages. I know this can be compensated for by having a large number of tests (even with high SDs, given enough tests you can be sure of the average) but I don't think 25-30 tests to allow this. I am looking for some kind of quantitation though, rather than just the feeling that it isn't enough.

I can give a little more info on the data, hopefully without biasing the interpretation.

The averages are procs per minute for Paralyse II using different sets of RDM gear.
Set 1 is basic RDM gear with 70 MND and 280 Enfeebling Skill.
Set 4 is basic RDM gear with 70 MND and 280 Enfeebling Skill and an Aquilo's staff.

By all rights, a HQ Staff should give no increase in Proc rate (and I think the data confirms that) so the 2 sets of data should not be significantly different.

Set 1 v Set 4 z = 0.1234 so the value from the Z table is about 0.049.
What I'm not sure of is what does that mean? Is there only a 5% chance the data is significantly different, or that there is a 95% chance they aren't significantly different?

For Set 1 v Set 2 z= 0.8228 (table value = 0.295)
For Set 5 v Set 4 z= 3.962 (table value = 0.500)

What does this actually mean? Does it mean that 5 and 4 are significantly different (which is my guess). What does the number for 1 v 2 actually mena?

I'm just having trouble interpreting these results...
 
Set 1

0

2.5
5
0.540540541

2.142857143
1.395348837
2.352941176
0
2.535211268

1.25
0
0
0
0
4
9
1.25

2.195121951
1.764705882
1.5

1.224489796

3.409090909
3.75
1.395348837

Set 2
2.553191489
2.142857143
6.666666667
2.8125
1.428571429
1.791044776
1.5
0
1.2
1.224489796
1.6
3.409090909
0
6.976744186
4.137931034
0.967741935
0.789473684
3.829787234
3.614457831
2.222222222
0.517241379
1.333333333
1.111111111

3.652173913
2.264150943
3.6
2.368421053
2.903225806
2.857142857

Set 3
1.643835616

1.395348837
1.263157895
3.495145631
3.050847458
2.857142857
3.962264151
6
2.162162162
1.518987342
4.06779661
5.714285714

4.137931034
1.2
4.421052632
2.790697674
2.666666667
1.538461538
2.97029703
0
3.103448276
5.333333333
1.818181818
0
3.287671233

0
2.891566265

Set 4
0.681818182
3.157894737
1.682242991
1.304347826
2.884615385
1.690140845
1.875
1.333333333
2.666666667
1.578947368
0.769230769
1.764705882
1.363636364
2.264150943
3.243243243
2.337662338
2.97029703
1.875
3
0
4.8
1.5
0
3.673469388
3.076923077
3.037974684
0.857142857
1.2
0
0.666666667

Set 5
1.512605042
3.962264151
2.941176471
4
4.5
3.370786517
4
3.103448276
4.337349398
2.033898305
1.034482759
2.278481013
3.333333333
0
2.465753425
4.655172414
3.428571429
4.225352113
5.052631579
3.461538462
1.034482759
4.615384615
4.186046512
2.580645161
3.428571429
4
3.214285714
1.081081081
4.033613445
2.823529412


Spaces are not data points, but 0's are. Each data point is a separate test.
 
mOK here we go!

They're listed in the following order: 1v2, 1v3, 1v4, 1v5, 2v4, 4v3, 4v5

Code:
Mean	1.966902348	2.39564037
Variance	4.201489259	2.806592222
Observations	24	29
Pooled Variance	3.435663435	
Hypothesized Mean Difference	0	
df	51	
t Stat	-0.838211045	
P(T<=t) one-tail	0.20291179	
t Critical one-tail	1.675284951	
P(T<=t) two-tail	0.405823579	
t Critical two-tail	2.007583728	


Mean	1.966902348	2.71445488
Variance	4.201489259	2.677645524
Observations	24	27
Pooled Variance	3.392919114	
Hypothesized Mean Difference	0	
df	49	
t Stat	-1.446629707	
P(T<=t) one-tail	0.07718387	
t Critical one-tail	1.676550893	
P(T<=t) two-tail	0.15436774	
t Critical two-tail	2.009575199	


Mean	1.966902348	1.908503686
Variance	4.201489259	1.375367253
Observations	24	30
Pooled Variance	2.625382756	
Hypothesized Mean Difference	0	
df	52	
t Stat	0.131606078	
P(T<=t) one-tail	0.447901882	
t Critical one-tail	1.674689154	
P(T<=t) two-tail	0.895803764	
t Critical two-tail	2.006646761	


Mean	1.966902348	3.156482827
Variance	4.201489259	1.593974827
Observations	24	30
Pooled Variance	2.747298518	
Hypothesized Mean Difference	0	
df	52	
t Stat	-2.620657535	
P(T<=t) one-tail	0.005739594	
t Critical one-tail	1.674689154	
P(T<=t) two-tail	0.011479189	
t Critical two-tail	2.006646761	


Mean	2.39564037	1.908503686
Variance	2.806592222	1.375367253
Observations	29	30
Pooled Variance	2.078425133	
Hypothesized Mean Difference	0	
df	57	
t Stat	1.297529568	
P(T<=t) one-tail	0.099837928	
t Critical one-tail	1.672028889	
P(T<=t) two-tail	0.199675857	
t Critical two-tail	2.002465444	


Mean	1.908503686	2.71445488
Variance	1.375367253	2.677645524
Observations	30	27
Pooled Variance	1.990989709	
Hypothesized Mean Difference	0	
df	55	
t Stat	-2.153174944	
P(T<=t) one-tail	0.017853046	
t Critical one-tail	1.673033966	
P(T<=t) two-tail	0.035706092	
t Critical two-tail	2.004044769	


Mean	1.908503686	3.156482827
Variance	1.375367253	1.593974827
Observations	30	30
Pooled Variance	1.48467104	
Hypothesized Mean Difference	0	
df	58	
t Stat	-3.966777466	
P(T<=t) one-tail	0.000101389	
t Critical one-tail	1.671552763	
P(T<=t) two-tail	0.000202778	
t Critical two-tail	2.001717468

Explanation:
1v2 is not significant
1v3 is not significant (although it is close with scenario 1 proc'ing less than scenario 2)
1v4 is not significant
1v5 is significant, scenario 5 shows a significant increase in proc rate over scenario 1
2v4 is not significant (although it does show scenario 2 proc's more than scenario 4 is not certain)
4v3 is significant, scenario 3 shows a significant increase in proc rate over scenario 4
4v5 is significant, this has the highest value T-value(term for comparison of two means) meaning it is the most significant. It shows scenario 5 proc's overwhelmingly more than scenario 4.
 
Thanks for that, that's basically what I'm looking for. The only other thing is I'd like, is to understand it a bit better if I'm going to use the data.

Do you have a link to the formulae you used for the test (or exactly which test it is, I've run into a few similar ones).

Also, you mention that 1v3 isn't significant, but it's close. Is there a quantitation for how close to significant the variations between the data are? (quite possibly it's in that data, but I'm not sure of the significance of some of the terms).
 
Nope, not my info, and all statistical analysis was done on my work computer (which doesn't have FFXI installed).

:P :P :P :P
 
I used Excel. The test was a "T-test two sample assuming equal variance." Variance is the the amount the data differs within each set (i.e. how much data point 1 of Scenario 1 varies from data point 2 of Scenario 1). "df" is degrees of freedom, its pretty much a term for how many times comparisons are formed between data points (the more the more statistically valid your data is). t-stat is the test statistic and the crit. values are the absolute values it needs to be in order to be significant at the .05 p level(only 5% of the time will actual results go against what you've found).

1v3 is at about a .09 p level meaning its not statistically significant by the means of common statistics, but it does mean that your data shows Scenario 2 will proc more than Scenario 1. That is true, you have data to support that, however the p-value of .09 means that there's a 9% chance that reality s different from your data.

That's pretty much what my education of stats is leading me to believe right now.
 
BAsically, what you're doing is comparing two sets of data to see if they could come from the same set of data. In the example you gave, the effects of an Aquilo's staff is tested in the effects of paralyze. Because of the random variation in data obtained, it's very difficult to know whether there actually is an effect on spell or not. In one instance, the data could be independant and the Aquilo's does have an effect. On the other, they could be dependant and has no effect.

What happens is this: You collect one set of data with the staff, another without. Because of the random variation in data, the sets could be different. Imagine that the population mean is 2.0, population being the set value giving by the program while the game randomly fluctuates around that value. The standard deviation of that value is 1. It's very possible that because of random variation, the staff shows 2.4 while without the staff it's 1.8. Is it because the data varies? Or is it because the data is actually different? That's what you're trying to find out.

What the math is doing is checking that for you. Because the two sets of data possibly follow their own curve (see below), we cannot just find the probability using a single curve. That's where this test comes in and it measures the confidence that they actually share the same population mean.

Note: These tests all assume that the data follows a bell curve. Can we assume that's true? I was always under the impression that most games or rather computer randomization had a mean value and every chance of occurance around the mean is equal. So it wouldn't even be a curve, but more like a straight horizontal line. That's to say, if the mean is 10 and the range is from 0 to 20, an occurance of 0 is just as likely as 15. With a bell curve, the further the numbers go from the average, the less likely they are to occur so a 0 is far less likely to happen than a 15.
 
The proc rate of paralyse is considered to be fixed for a specific set of gear, but in this case, it has a fixed % chance of going off every mob swing. Given enough data points, the average would approach the true value, and the further a result was from the average, the less likely to occur, the result would be.

Whether it is a normal (symmetrical?) or binomial (asymmetrical?) curve though, I'm not sure.
 
Sorry, just a couuple more questions too. Should the 1 tail aor 2 tail value be being used? (ie whats the difference?)

I can't see a 0.9 in the 1v3 analysis. Which figure exactly is being referred to?
 
The proc rate of paralyse is considered to be fixed for a specific set of gear, but in this case, it has a fixed % chance of going off every mob swing. Given enough data points, the average would approach the true value, and the further a result was from the average, the less likely to occur, the result would be.

Whether it is a normal (symmetrical?) or binomial (asymmetrical?) curve though, I'm not sure.

Then it really should be a binomial function since it only has two options, a proc or no proc. Not sure about how to go about doing a test on the significance of it, but I could check later possibly.

Sorry, just a couuple more questions too. Should the 1 tail aor 2 tail value be being used? (ie whats the difference?)

I can't see a 0.9 in the 1v3 analysis. Which figure exactly is being referred to?

The tail is really dependant on the null hypothesis. The null hypothesis in your case should be that the sample means are the same and the alternative hypothesis is that they are not. Since you're not specifying that they are greater or less than the mean, just different, two-tail is preferred. If you were under the impression that the impact of an Aquilo's staff has a positive or negative impact, you should use a single-tailed value.
 
Back
Top